
Ask across policy, place and data
Question planning instruments, judgments, development activity and socio-economic data in plain English. Keep the source beside the answer.
Planning evidence is scattered across instruments, maps and datasets. Name any lot and Plynth brings its zoning, height, FSR, overlays, development activity and census profile into one place, with every answer cited to its policy source.
Planning controls, maps, development activity, census and market signals live in different systems.
Plynth connects parcel context, planning sources, spatial datasets and cited analysis in one connected workspace.
Scattered sources → one traceable analysisBuilt for Australia · full feature rollout starts in NSW
Different questions, same rule: test the case against the data and keep the evidence traceable.
Resolve the site, inspect the controls and carry cited findings into design, advice and project documentation.
Compare planning constraints, development activity, demand, affordability and supply before forming your own view.
Question spatial and socio-economic data, compare geographies and keep the sources and caveats beside each finding.
The maximum building height for this lot is 9 metres under the LEP height-of-buildings map. The proposed 8.4 m sits within it.
Floor space ratio is capped at 0.5:1. The heritage conservation overlay applies, so a Heritage Impact Statement is required.
Every answer is connected to the policy source that supports it.
Enter an address, select an area or ask a question. Plynth resolves the planning, spatial and data context that matters.
Compare controls, development activity, demographics, market and supply signals, with the source kept beside each finding.
Turn the analysis into an editable, cited report with the map figure and controls attached.
Plynth brings planning, GIS, development and socio-economic data into one working map. Explore zoning, controls, hazards, transport, market and supply signals by place, with cited AI analysis alongside them.

79 planning and infrastructure layers, 3D building footprints, lot boundaries, hazards and heritage on one basemap.
The live development pipeline: tracked DAs, approval outcomes and housing policy, per council, refreshed nightly.
Compare demographics, affordability, supply, transport and development activity across places, then ask what explains the difference.
Move from a question to cited analysis across policy, place, precedent, market and supply. Keep the evidence close enough to challenge and refine the work.
Question planning instruments, judgments, development activity and socio-economic data in plain English. Keep the source beside the answer.
Use demographic, affordability, supply, transport and market signals to compare suburbs and check whether a pattern holds.
140,000+ DAs across nearly every NSW council, coloured by outcome, plus 855 draft rezonings. Refreshed nightly.
NCC 2025 and 2022, all volumes plus the Housing Provisions, indexed and browsable, with answers cited to the clause.
Select a lot or draw an area. Plynth builds an editable, cited report with the map figure and controls attached.
Set planning constraints beside demand, affordability and supply signals. Use the combined view to inform your own assessment.
Every figure below is counted from the production database. Together, they let users examine a site, compare places and test their own questions against a traceable body of evidence.
Counts as at July 2026 · development activity refreshes nightly
Planning controls follow the land. Plynth resolves the site's spatial context: zone, overlays, heritage, flood and bushfire, so the answer is grounded in the controls that actually apply to this lot.
field notes ↗Deterministic checks return pass, fail or undetermined. Discretionary matters are surfaced as findings that require assessment: flagged for your professional judgement, never quietly decided for you.
The final status is computed by a deterministic decision matrix. The model's job is to explain the result in plain English, not to decide it. That boundary makes the output auditable.
Every answer opens to an intelligent citations view: source instrument, section, effective date, confidence score, data tier and the exact words highlighted on the original page. Everything you need to check it, faster than you could find it yourself.
NSW legislation·NSW Planning Portal·National Construction Code·ABS Census
Resolve the lot you're standing on, check an overlay mid-inspection, and send the cited answer before you're back at the desk.
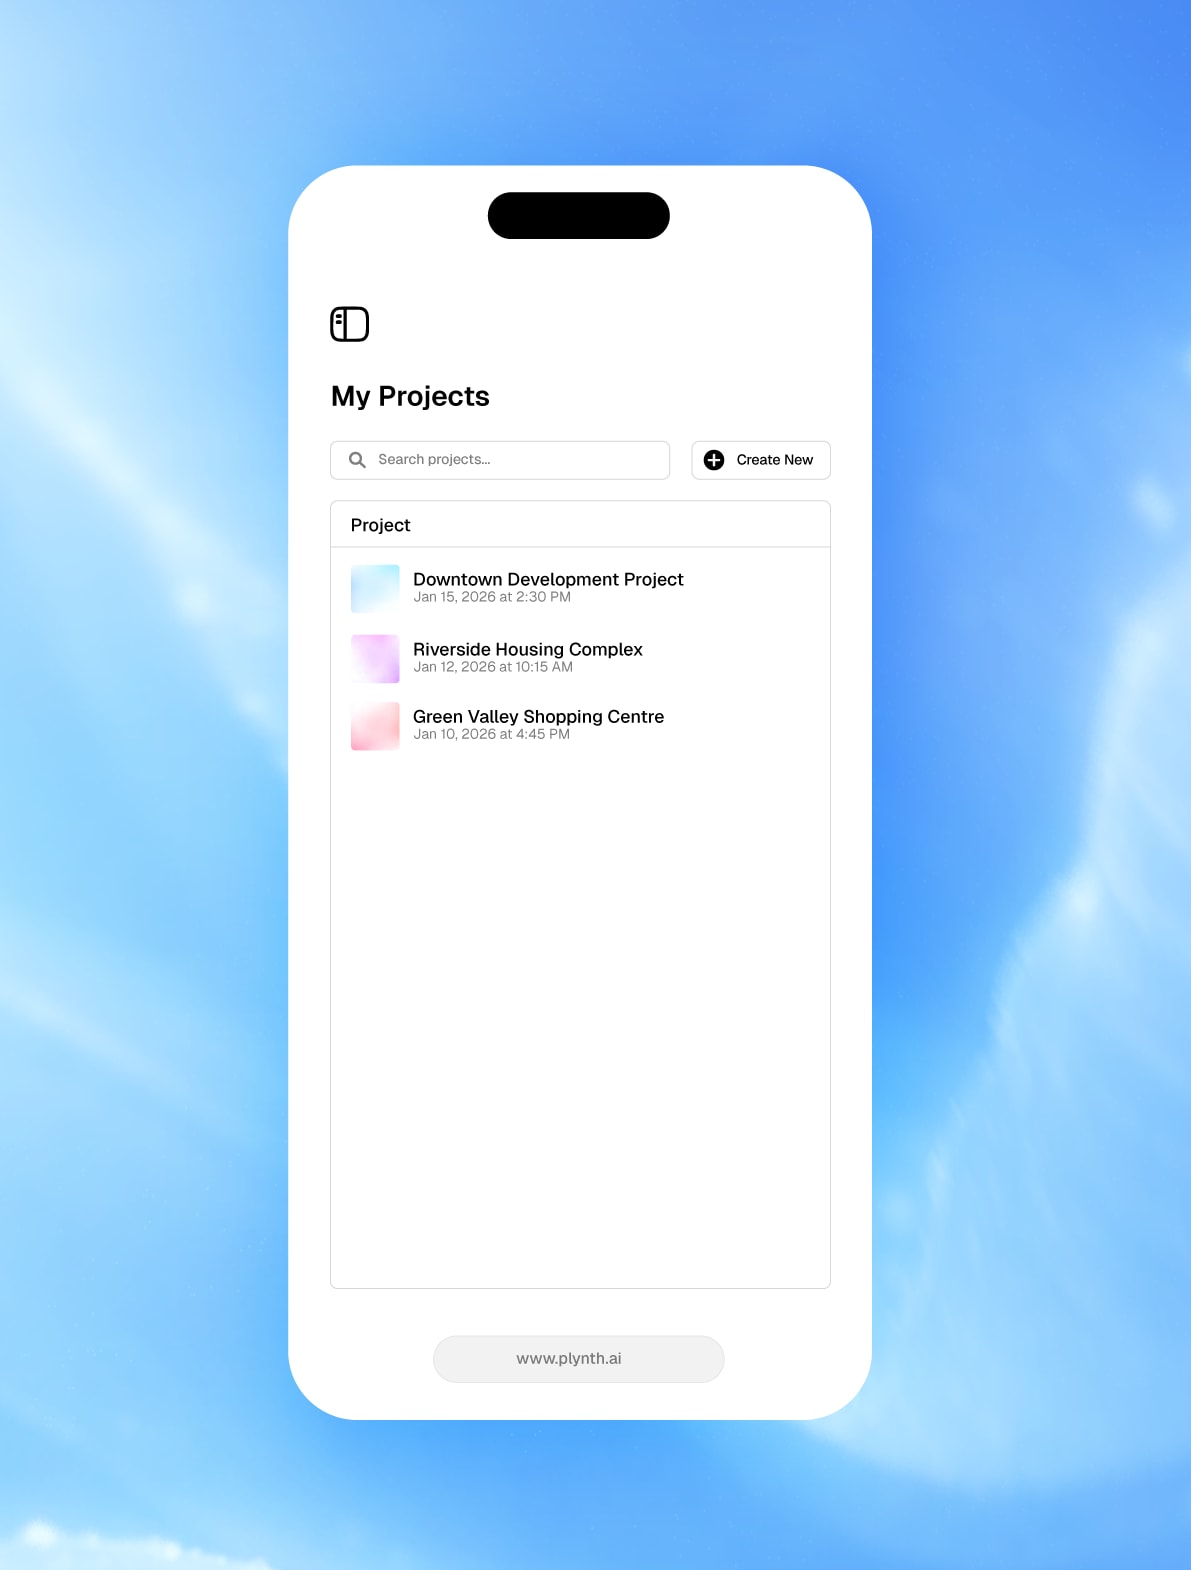
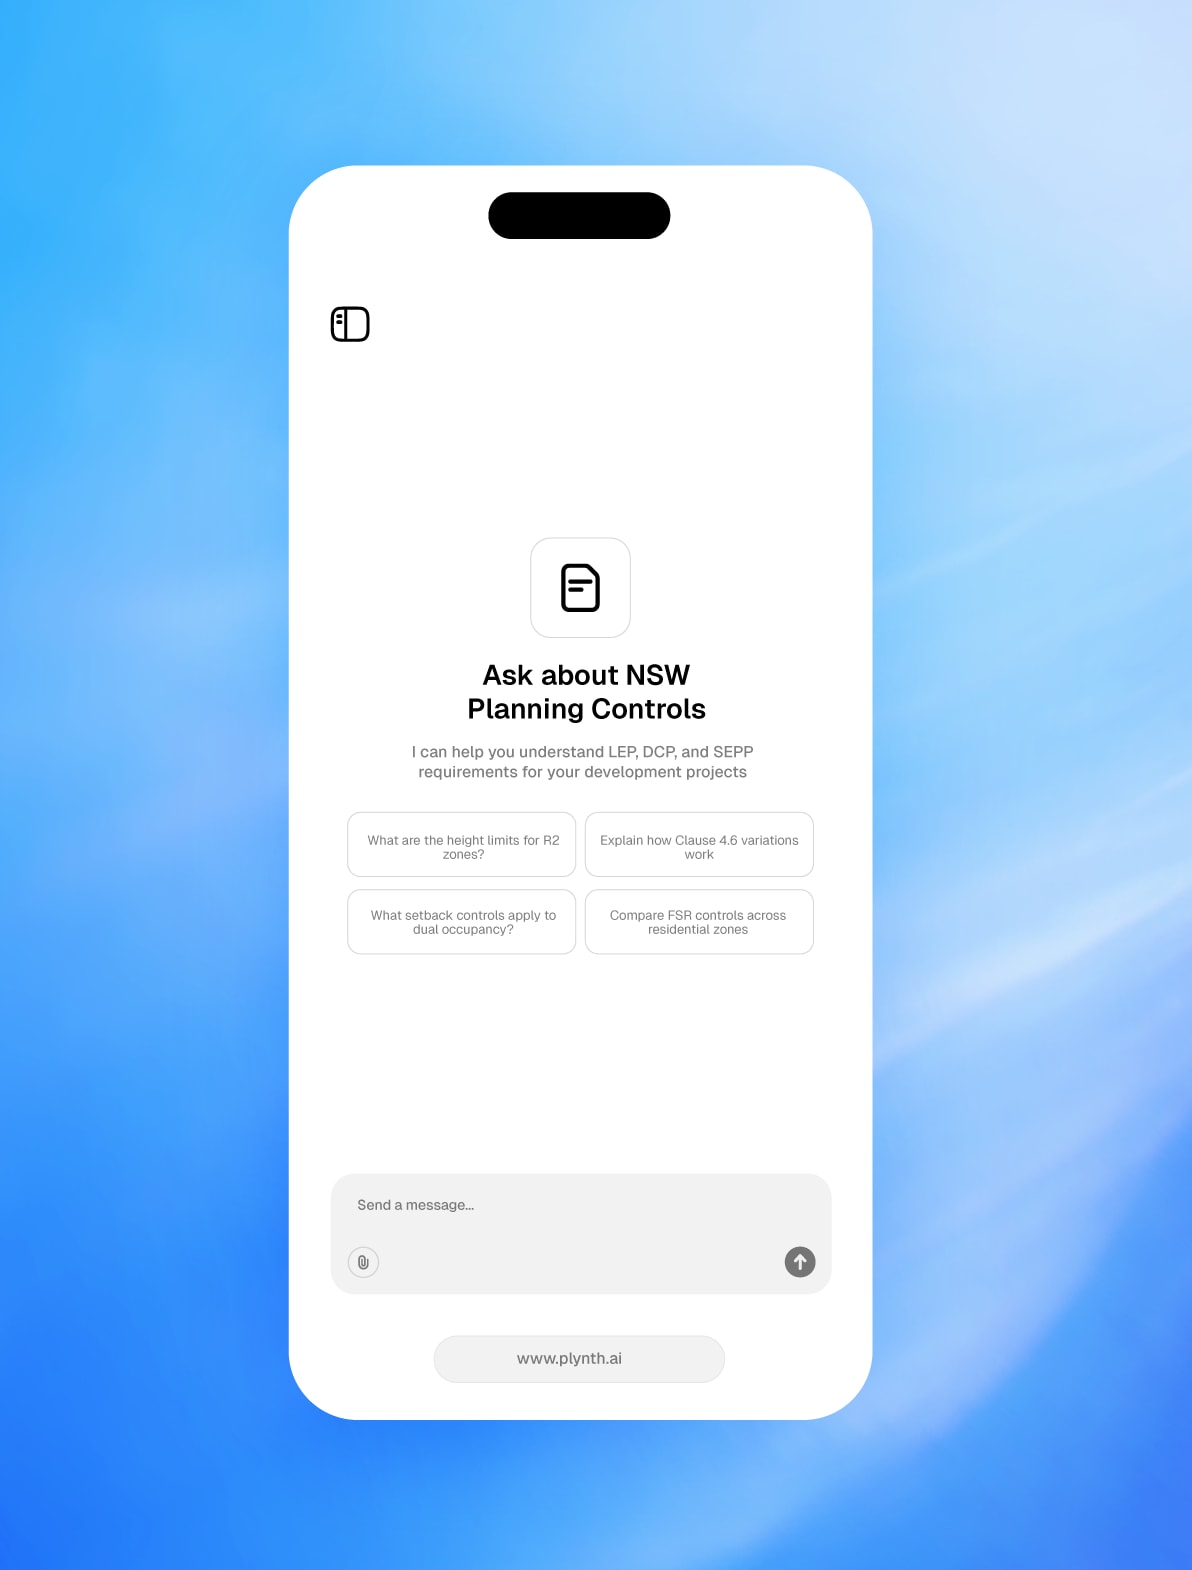
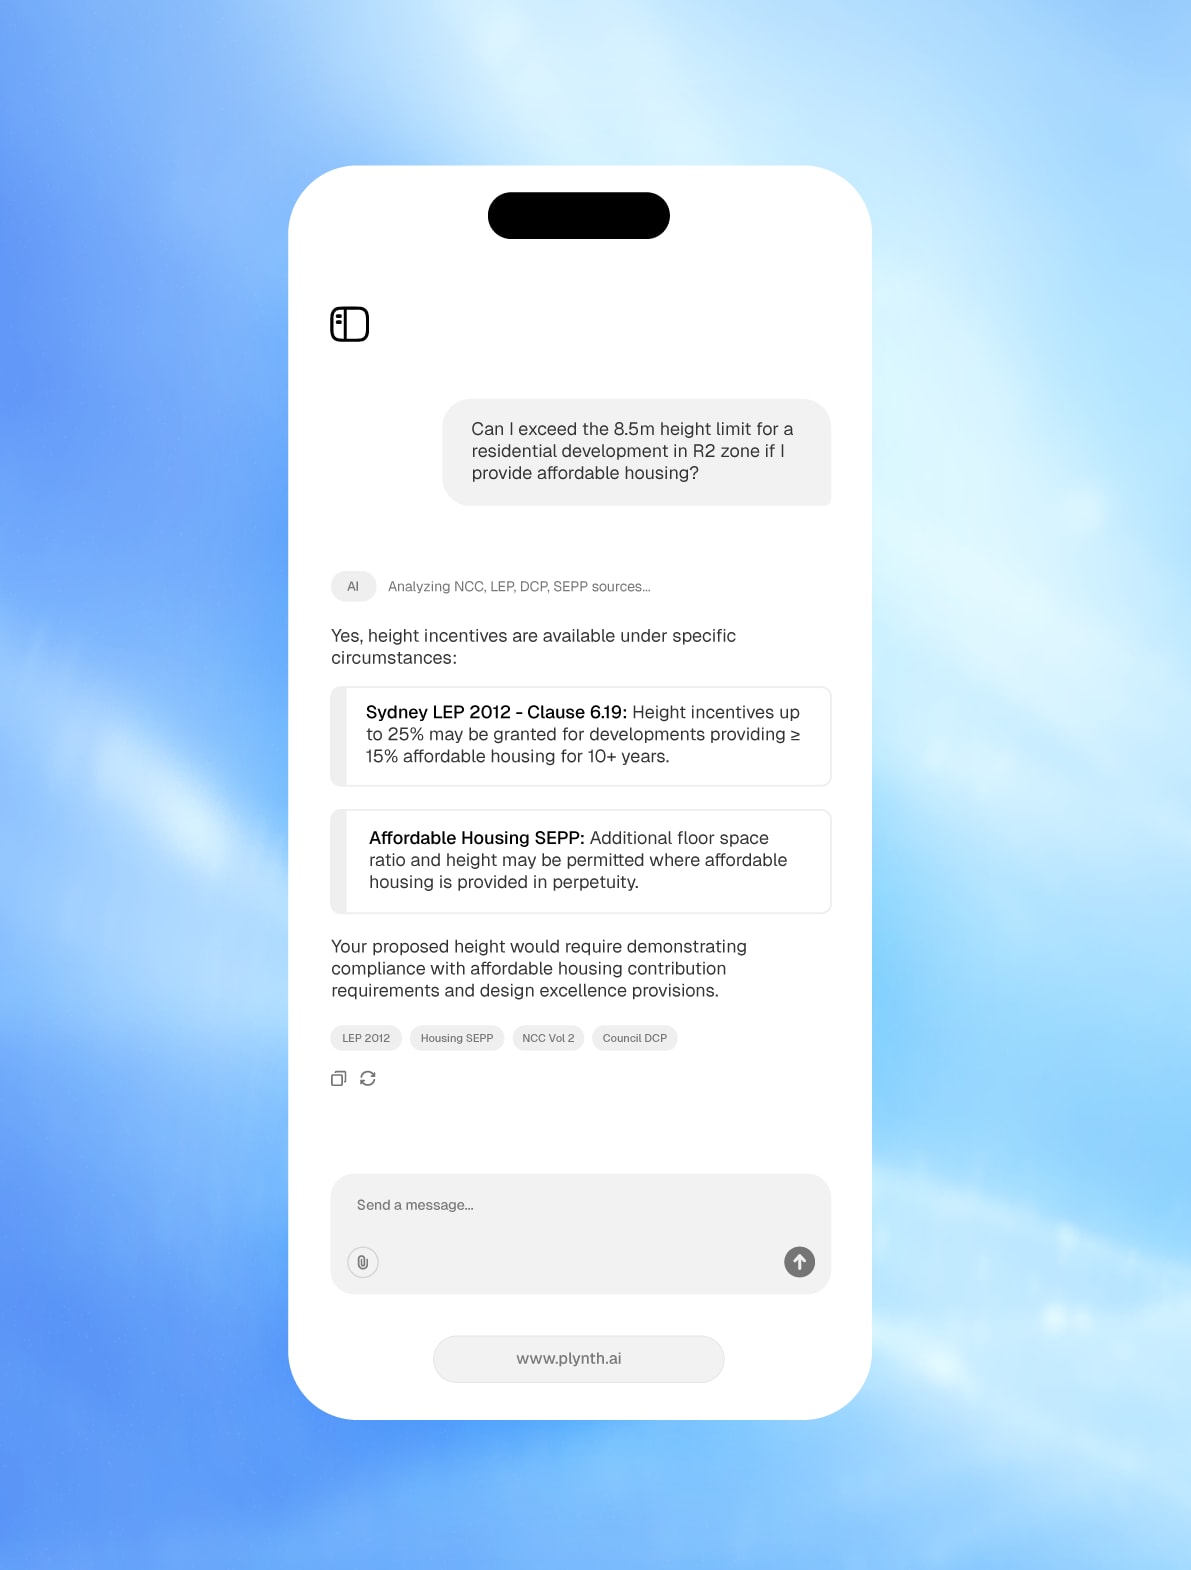
Launching with a limited early-access cohort. View the early-access offer How credits work
Built for architects, planners, researchers and property teams who need to check the answer for themselves.